Cross-browser testing on Android from macOS
 Jon Sakas
This article is part of a three-part series on cross-browser testing Windows, iOS, and Android from macOS.
If you want to test your websites on an Android device, one option is to use an Android emulator to open a browser and navigate to your website. Android Studio, the official IDE of Android, ships with a built in emulator similar to the one we used in our previous post on cross-browser testing on iOS devices from macOS.
Note: This article was written using the following operating system and software versions:
– macOS Catalina, Version 10.15.7 on a MacBook Pro (Retina, 15-inch, Early 2013)
– Android Studio 4.1.0
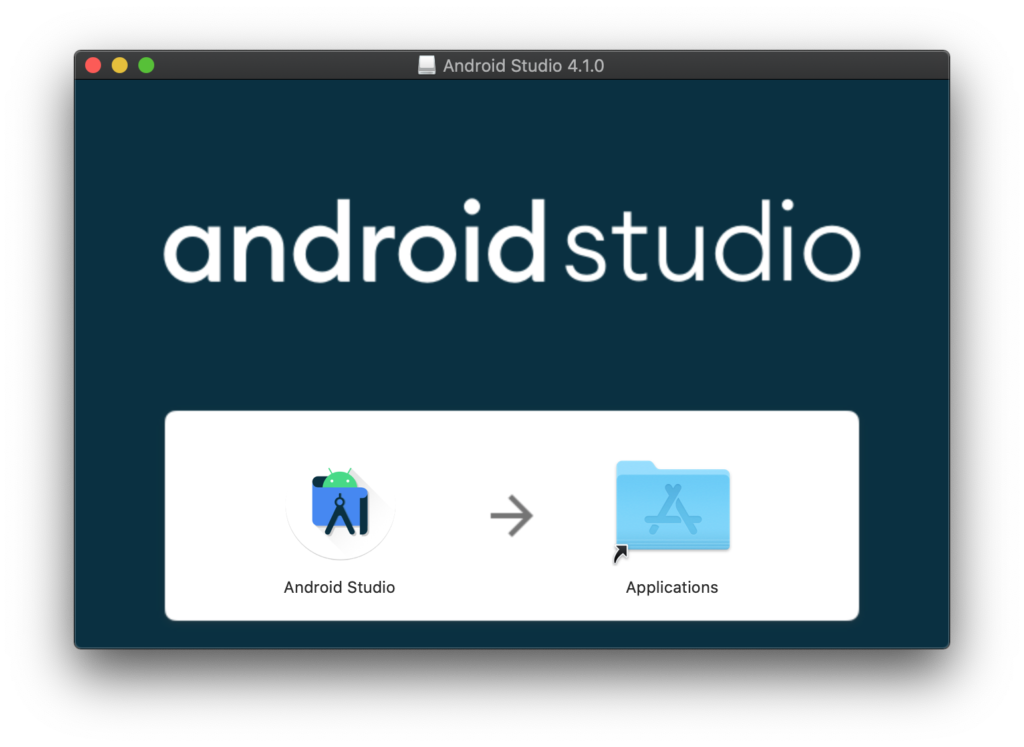
To get started download Android Studio for Mac and install the application.
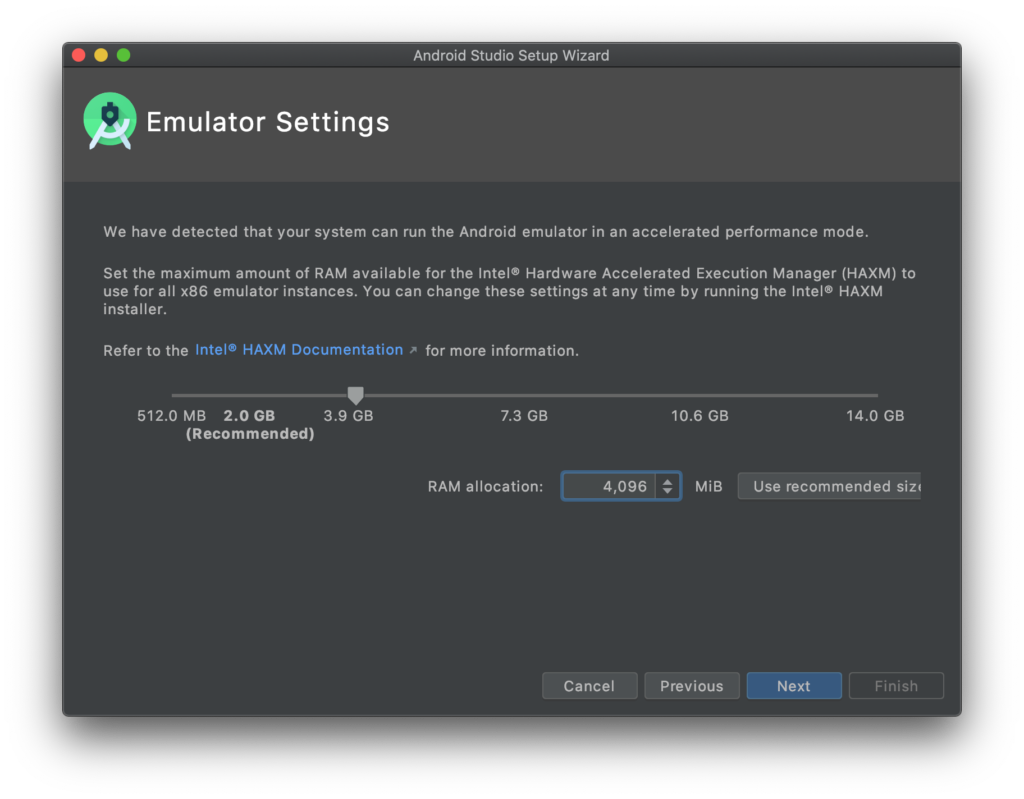
After launching the application, you’ll be asked to set the emulator settings if your system can run the emulator in an accelerated performance mode. I like to bump up the RAM allocation slightly to at least 4 GB.
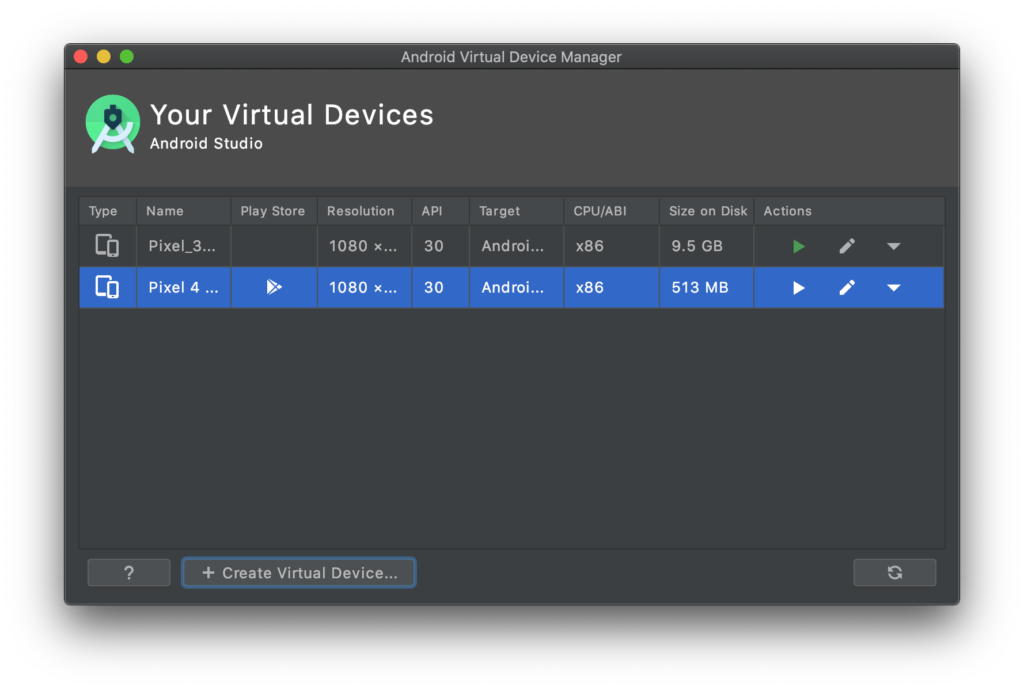
Once Android Studio is installed, you don’t actually need to create or run a project to run the emulator. At the home screen, you can select AVD Manager from the Configure Menu in the bottom right.
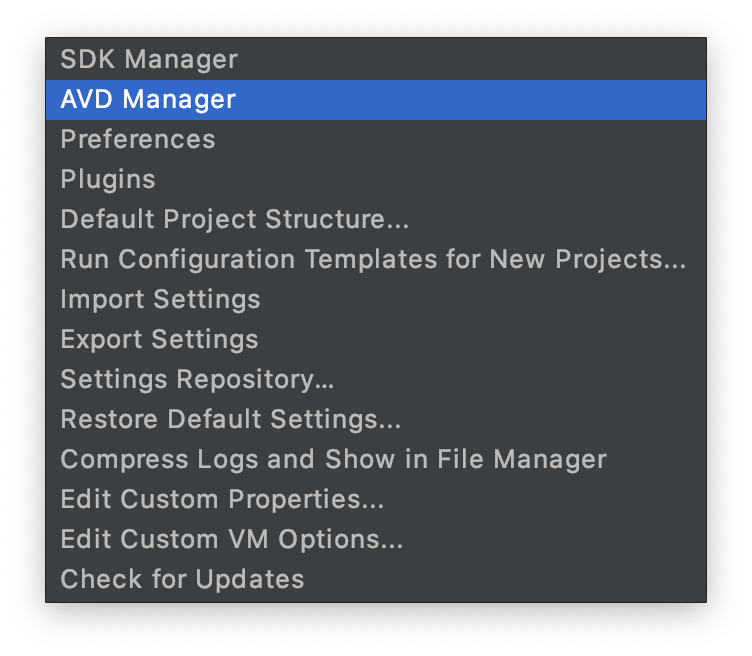
From this menu, you should see at least one emulator, with a green start button to run it, as well as a button to Create new emulator.
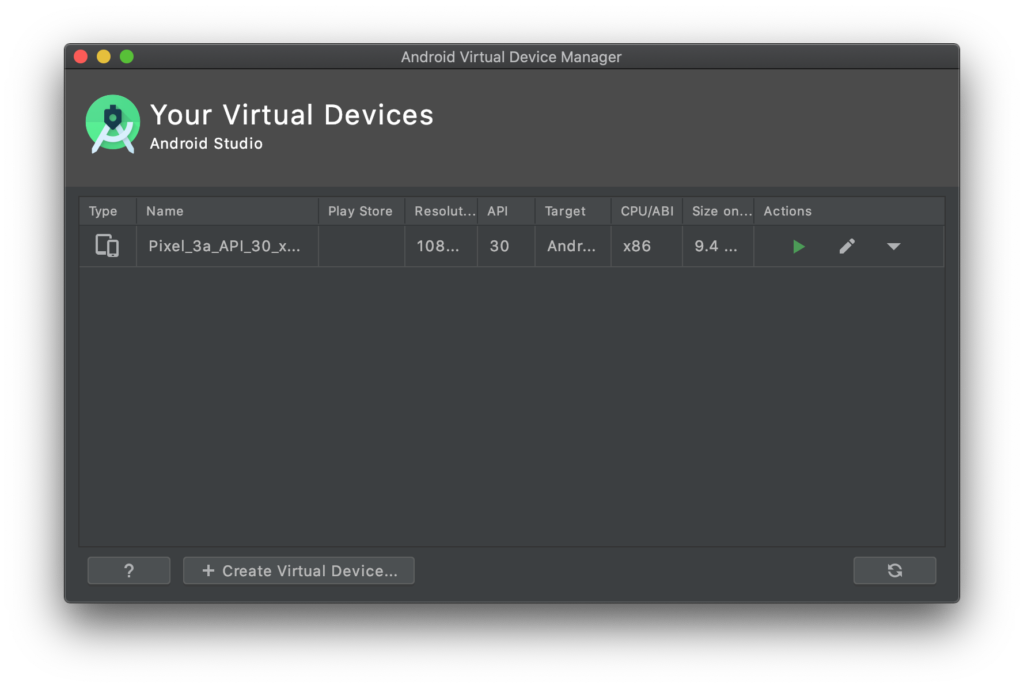
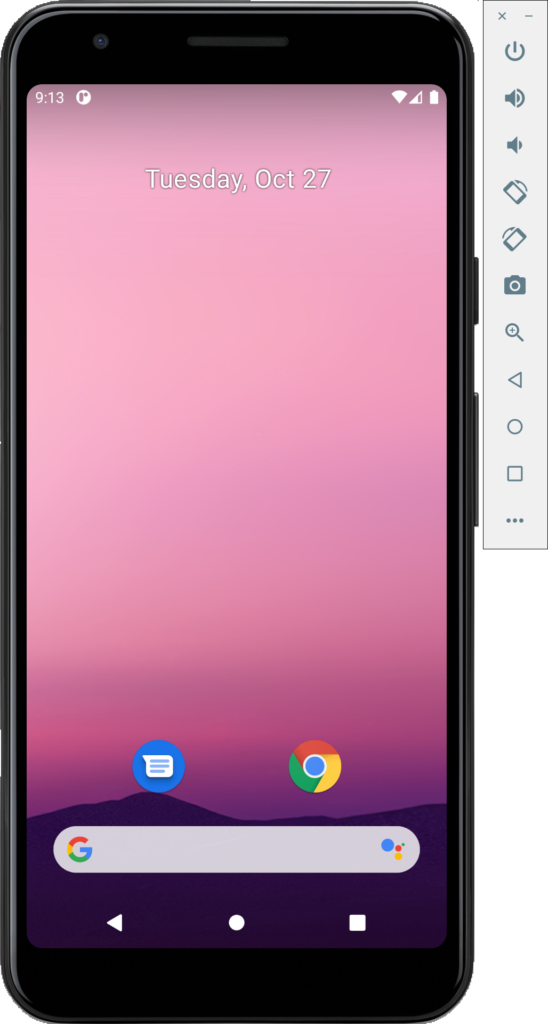
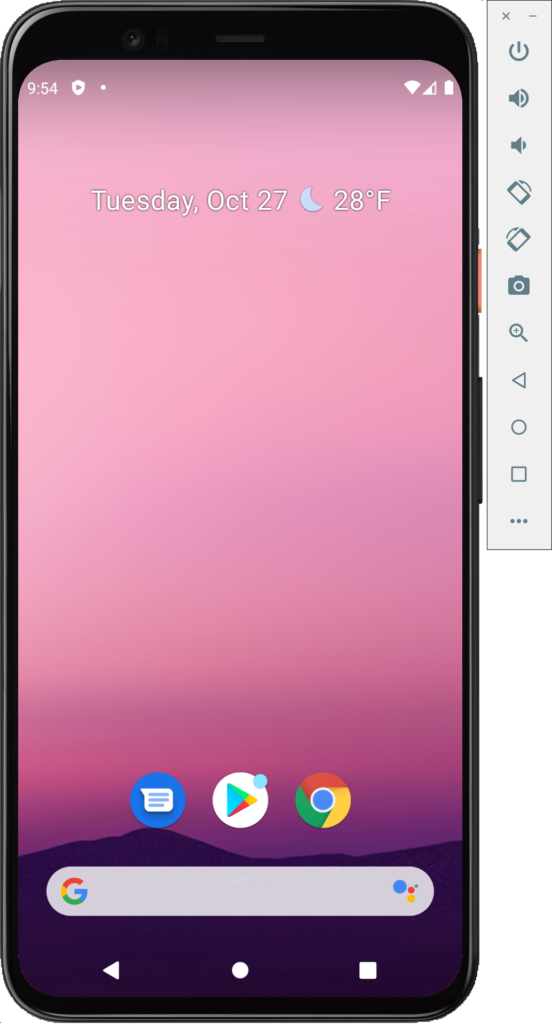
From here you can start any existing Virtual Devices that are already available to you by clicking the green play icon. After launching the device you will see it boot up on your screen, and eventually will be taken to the devices home screen.
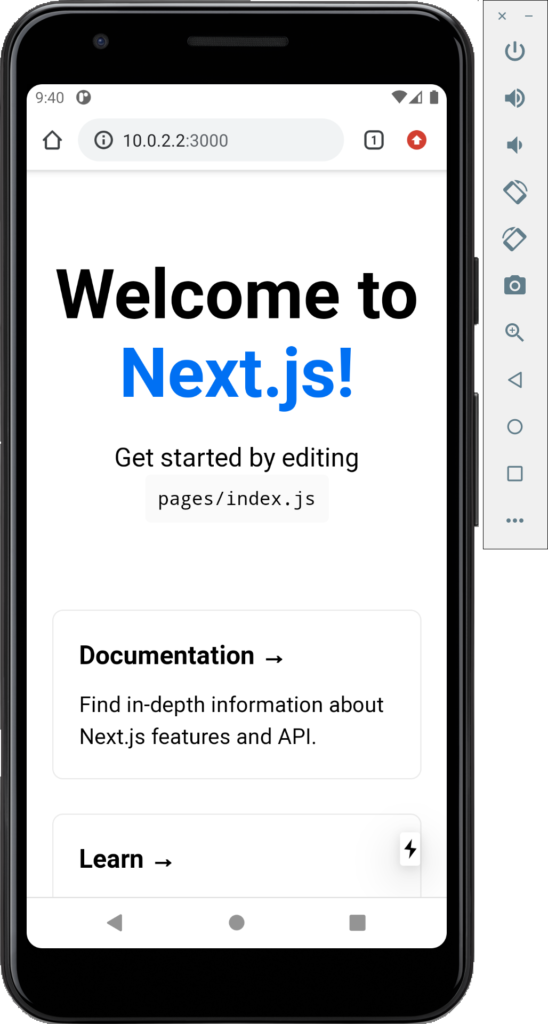
With the emulator running, you can now access your websites running on the host machine’s localhost, on 10.0.2.2. For example, if you have a NextJS app running on http://localhost:3000, you would be able to access that on the emulator on http://10.0.2.2:3000.
Adding additional emulator devices
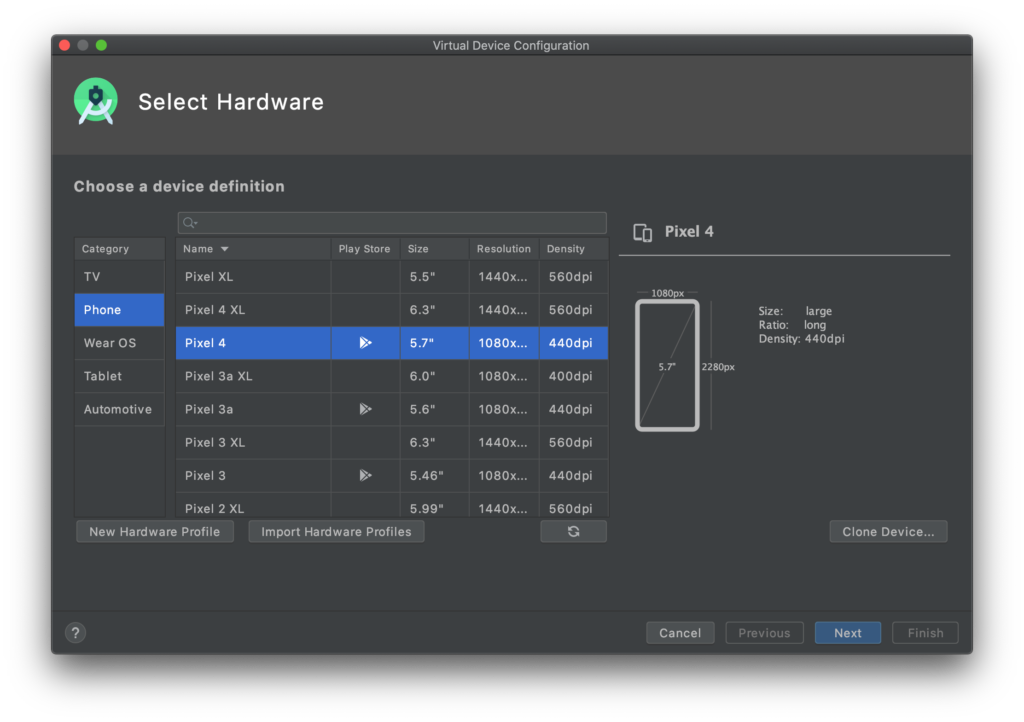
From the Android Virtual Device Manager screen, click “Create Virtual Device” to bring up the Virtual Device Configuration Screen. You’ll see a number of virtual hardware devices to choose from, select one and click next.
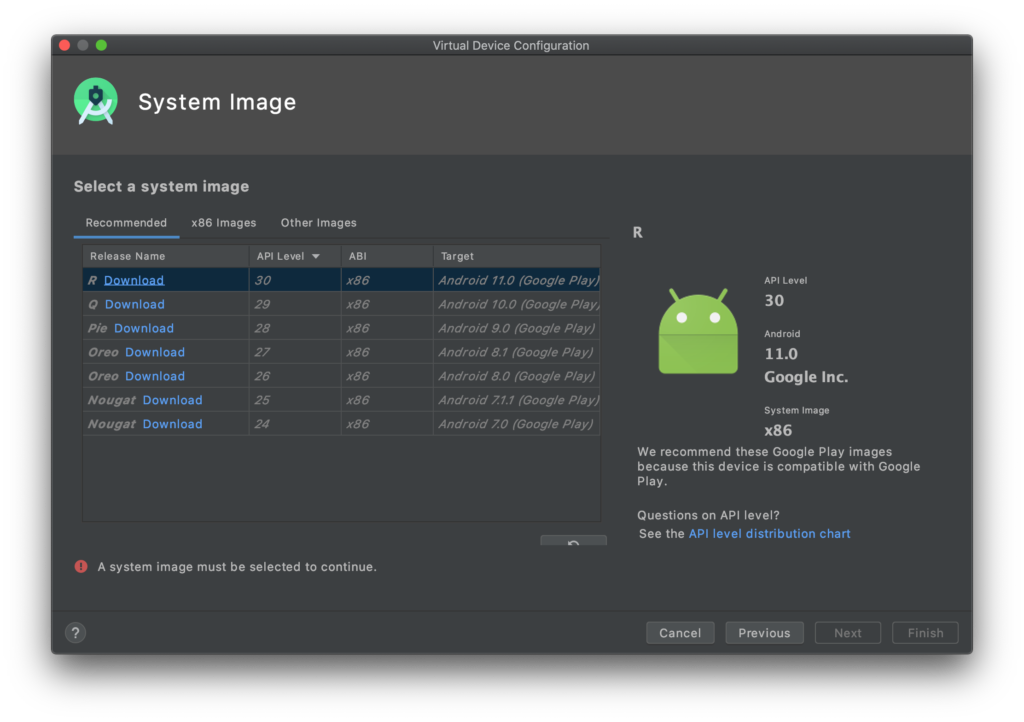
From there, you’ll be required to select the operating system you want to install. If you don’t have the system image already available, you’ll need to download it by clicking the Download button.
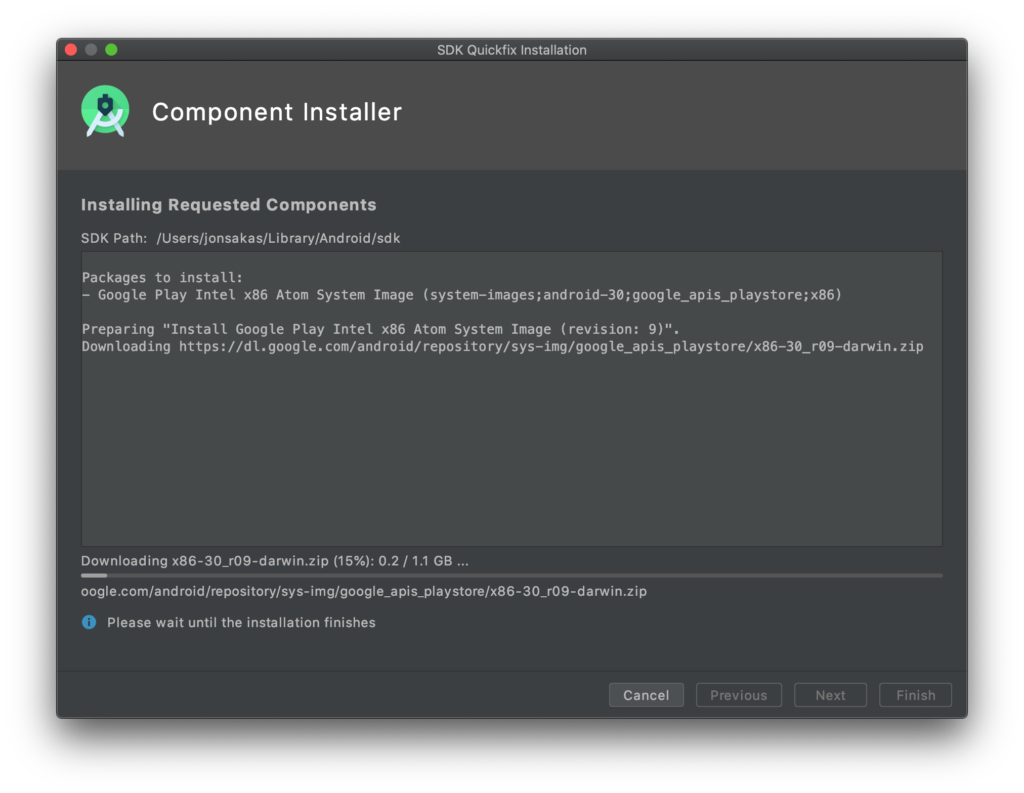
Download and walk through the component installer.
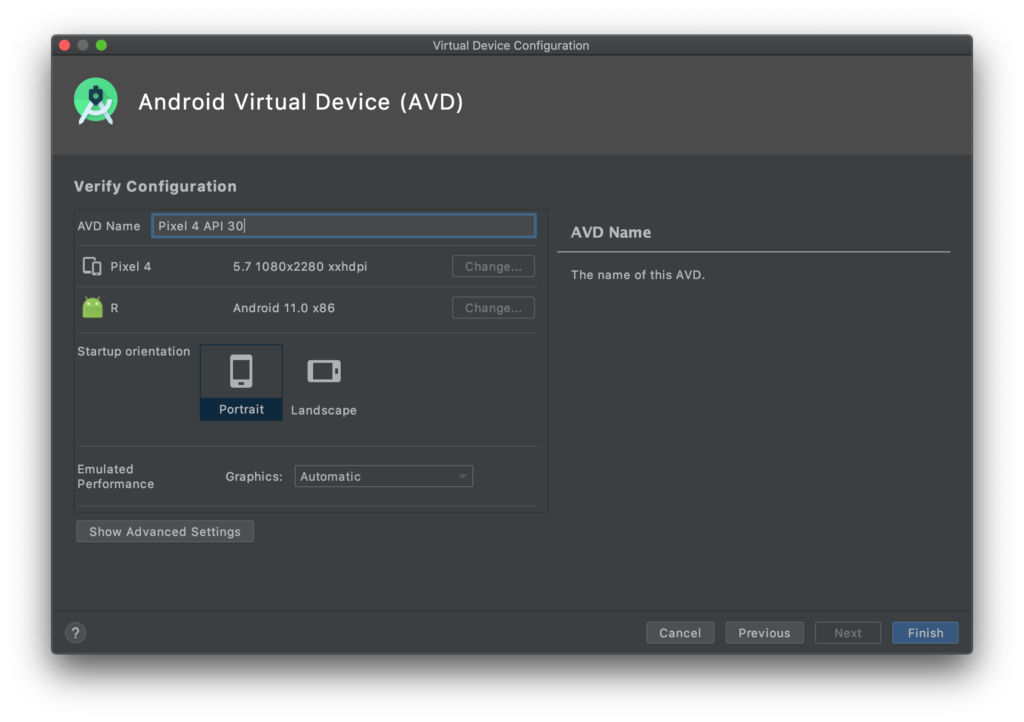
Once downloaded, you’ll be asked to give your Android Virtual Device a name and can set a few more options like the default orientation. Click finish to finalize the virtual device configuration.
You should now see the newly created AVD in the Android Virtual Device Manager.
Click the green play icon to launch your newly created AVD.
Launching emulators from the command line
Once you’ve created some Android Virutal Devices in the steps above, you may decide to launch them from the command line to save time in your workflow. In the examples below we’ll be using iTerm2, but you can use any terminal application.
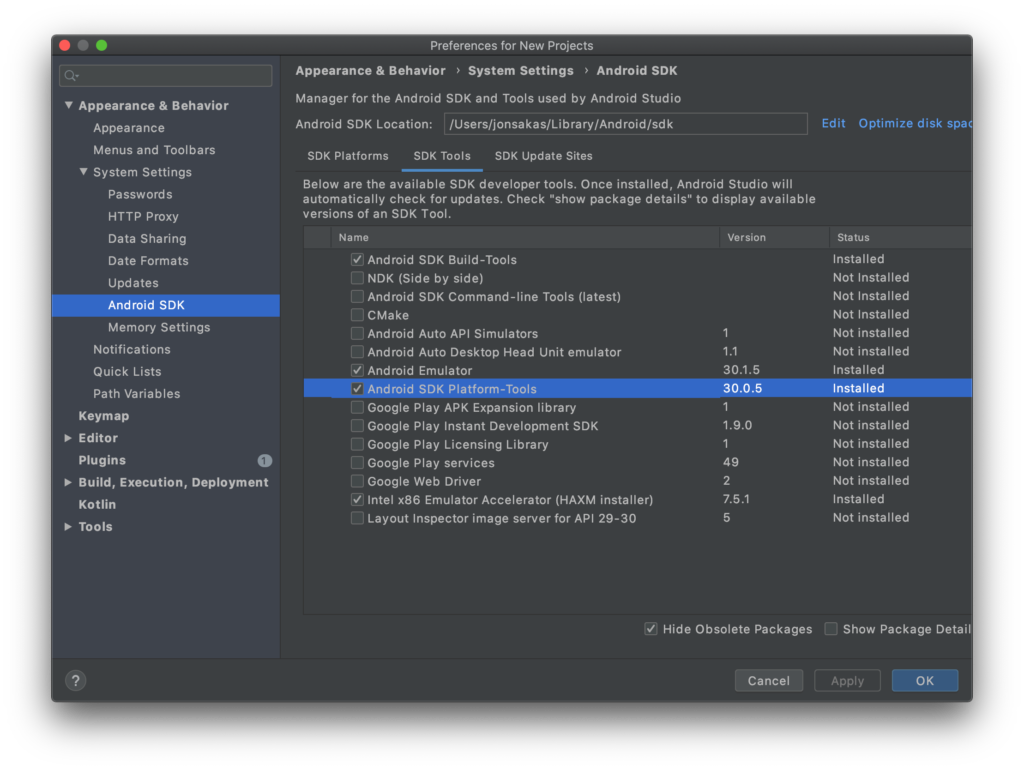
First, enter the preferences by navigating to Android Studio > Preferences, and then Appearance & Behavior > System Settings > Android SDK.
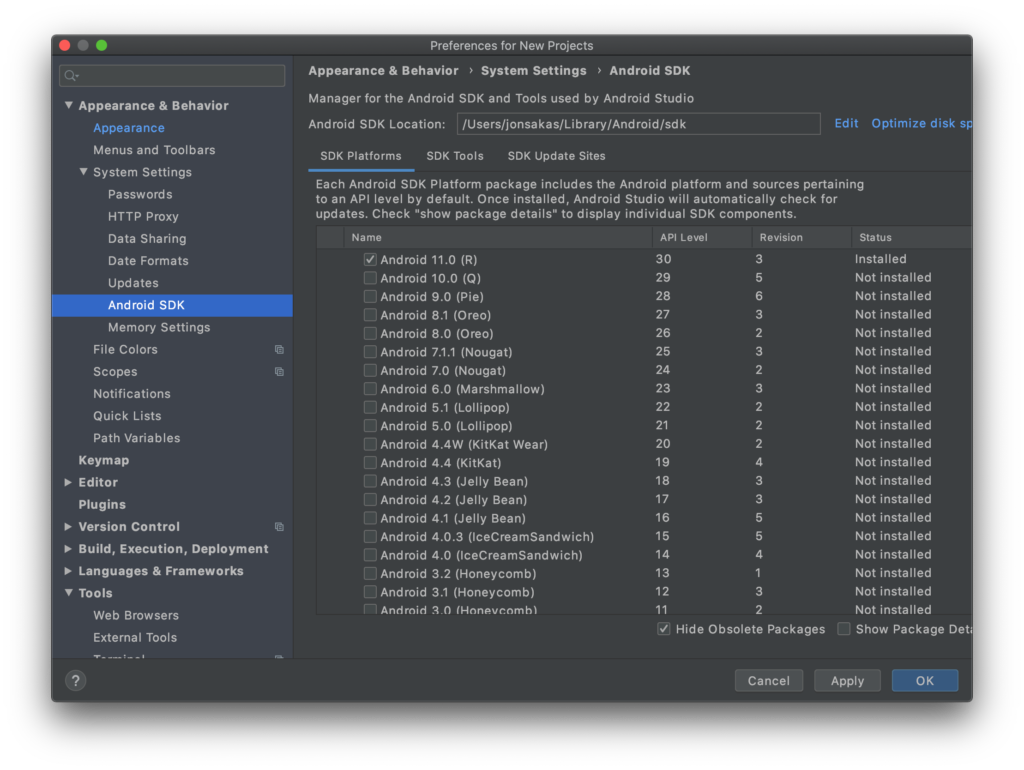
From this menu we are looking for the “Android SDK Location”. Copy the location and head over to your terminal.
The emulator executable is located in the “emulator” folder and is also named “emulator”. So in my case, I want the full path to the emulator to look like:
/Users/jonsakas/Library/Android/sdk/emulator/emulatorFor ease of use, we’re going to alias this in our bash_profile so we don’t need the entire path and can just type “emulator” into the command line.
echo alias emulator="/Users/jonsakas/Library/Android/sdk/emulator/emulator" >> ~/.bash_profile
. ~/.bash_profile
Now, you can use the command emulator -list-avds to see which emulators are available to you.
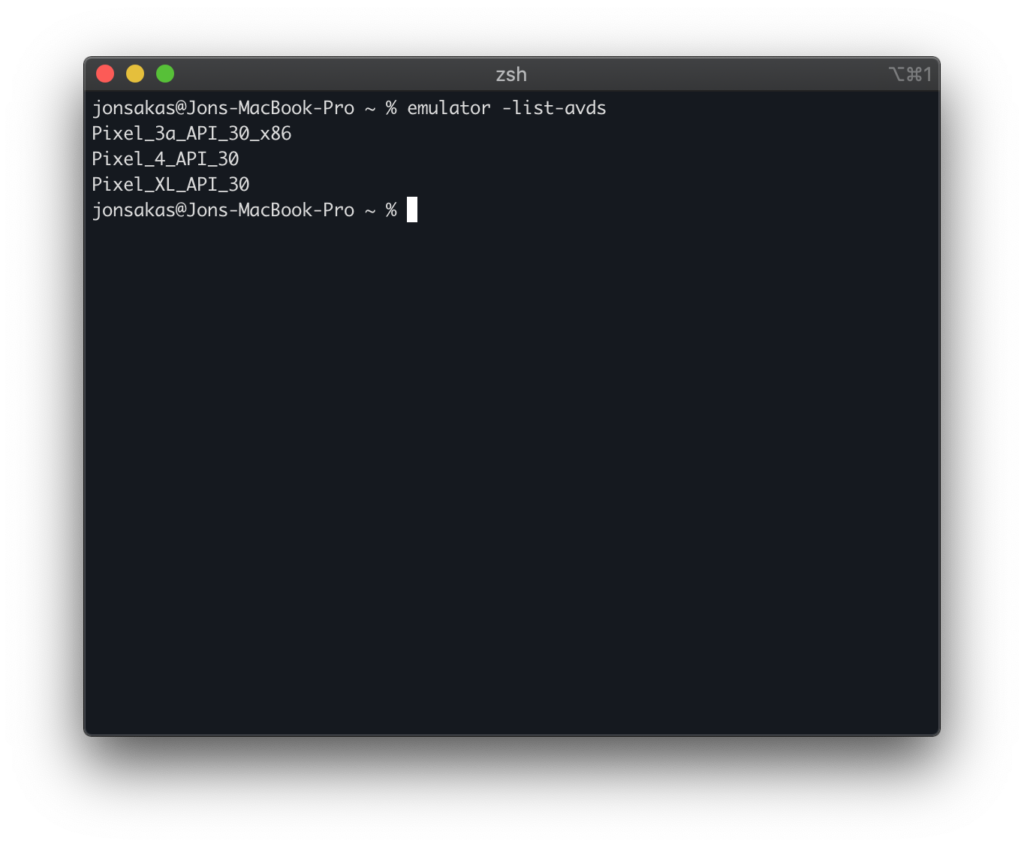
Now that we have the emulator command aliased, and we can view a list of emulators. We can easily launch new emulators by running emulator -avd [EMULATOR]. For example:
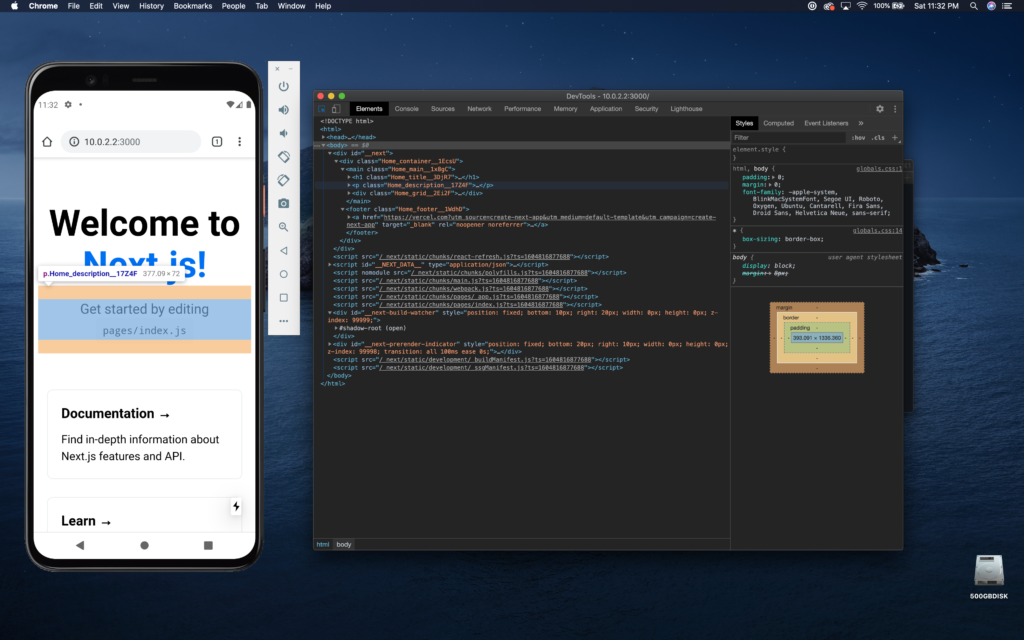
emulator -avd Pixel_4_API_30Debugging with the Chrome Web Inspector
If you want to take your AVD testing and debugging a step further, you can connect it to your desktop version of Chrome and debug using the Chrome Developer Tools.
In order to do this, you must first run the Android Debug Bridge (“adb”) from the command line.
To use ADB, first ensure you have the Android SDK Platform-Tools installed. You can find this information from the Android SDK > SDK Tools menu of the Android Studio preferences.
The adb program will be in the Android SDK location under the platform-tools directory. In my case it would be found at:
/Users/jonsakas/Library/Android/sdk/platform-tools/adbJust like the editor, we’re going to alias this in our bash_profile so we don’t need the entire path and can just type “adb” into the command line.
echo alias adb="/Users/jonsakas/Library/Android/sdk/platform-tools/adb" >> ~/.bash_profile
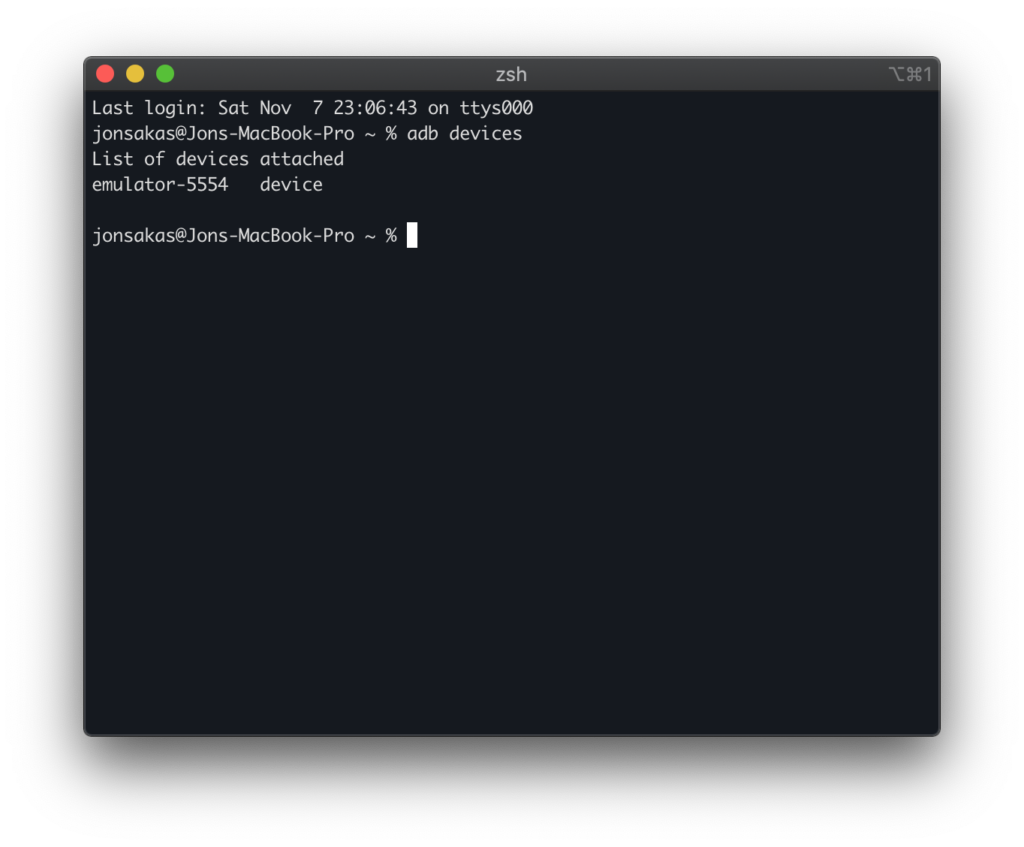
. ~/.bash_profileNow you should be able to run adb in the terminal and see the program help screen. With the virtual device running, run adb devices, which will start the bridge if it’s not already running and print any devices found with their status. If its set up properly, you should see an emulator with “device” next to it.
Launch Chrome on the virtual device, and also on your host machine. On your host, navigate to chrome://inspect/#devices. You should see the emulator and an option to open a new tab from the list.
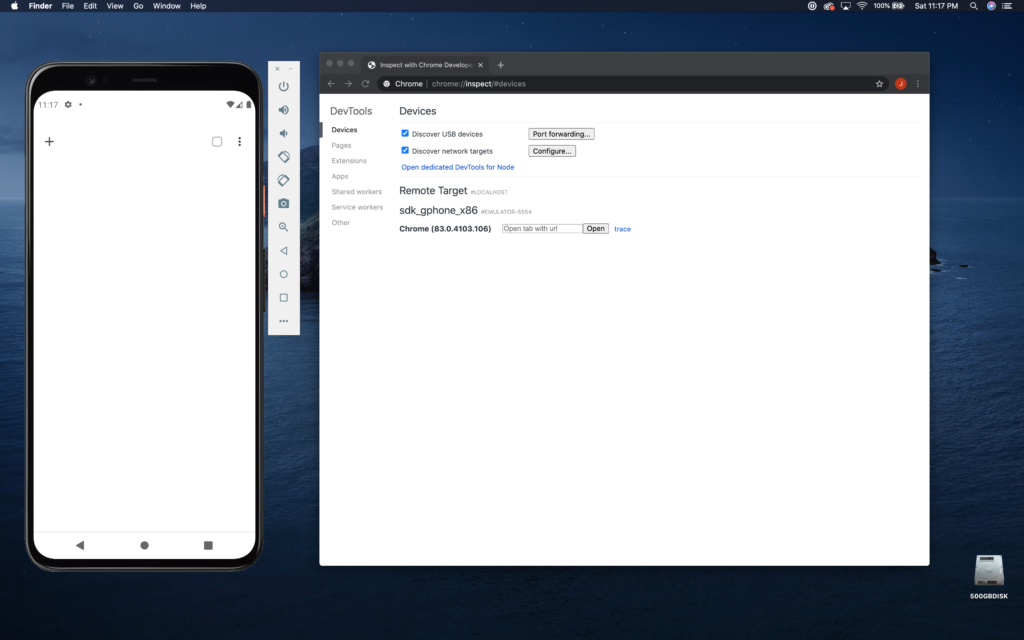
You can either open tabs on the device itself, or type the name of your host in the text input and click open. Remember your host machine localhost will be 10.0.2.2 on the AVD.
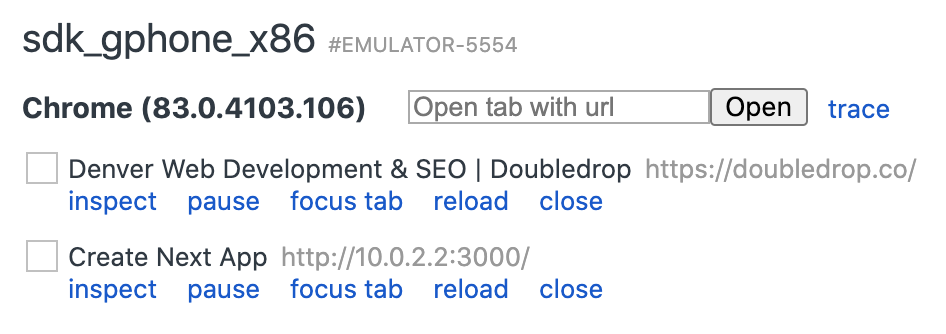
Any tabs found on the AVD will show up under the device, and you can open the Chrome Developer Tools by clicking the “inspect” link. From there, a familiar Chrome DevTools window will be available and should be connected to the browser on the Android Virtual Device.